Note
Go to the end to download the full example code
Similarity and Distance
This tutorial illustrates how to calculate similarity and distance between images.
Load Data
First, let’s load the pain data for this example.
from nltools.datasets import fetch_pain

data = fetch_pain()
/usr/share/miniconda3/envs/test/lib/python3.8/site-packages/nilearn/maskers/nifti_masker.py:108: UserWarning: imgs are being resampled to the mask_img resolution. This process is memory intensive. You might want to provide a target_affine that is equal to the affine of the imgs or resample the mask beforehand to save memory and computation time.
  warnings.warn(
Distance
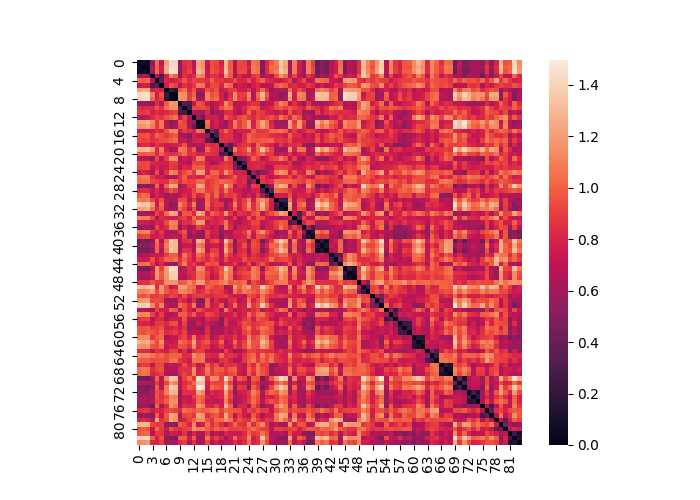
We can calculate the pairwise spatial distance between all images in a Brain_Data() instance using any method from sklearn or scipy. This outputs an Adjacency() class object.
d = data.distance(metric='correlation')
d.plot()
Similarity
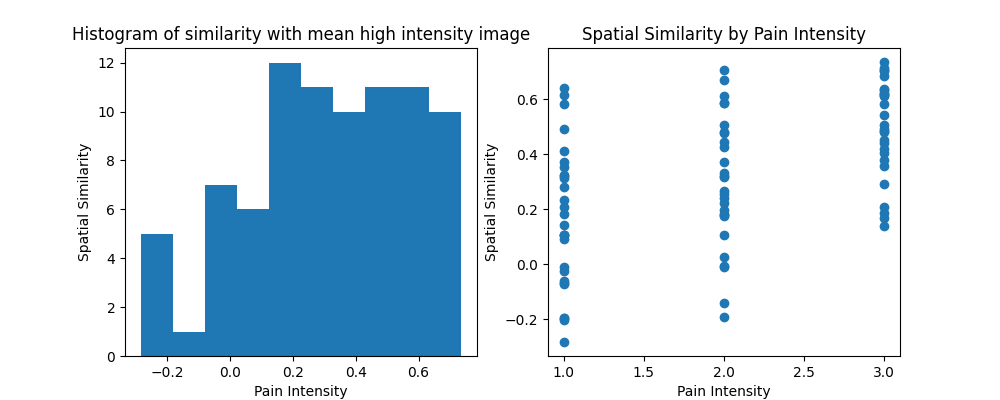
The similarity of an image to other images can be computed using the similarity() method. Here we calculate the mean image for high pain intensity across all participants and calculate the degree of spatial similarity between this image and all pain intensities for all participants. This is a useful method for calculating pattern responses.
import numpy as np
import matplotlib.pylab as plt

high = data[np.where(data.X['PainLevel']==3)[0]].mean()
r = high.similarity(data, method='correlation')

f,a = plt.subplots(ncols=2, figsize=(10,4))
a[0].hist(r)
a[0].set_ylabel('Spatial Similarity')
a[0].set_xlabel('Pain Intensity')
a[0].set_title('Histogram of similarity with mean high intensity image')
a[1].scatter(data.X['PainLevel'],r)
a[1].set_ylabel('Spatial Similarity')
a[1].set_xlabel('Pain Intensity')
a[1].set_title('Spatial Similarity by Pain Intensity')
Text(0.5, 1.0, 'Spatial Similarity by Pain Intensity')
Total running time of the script: (0 minutes 31.062 seconds)