Note
Go to the end to download the full example code
Univariate Regression
This example simulates data according to a very simple sketch of brain imaging data and applies a standard two-level univariate GLM to identify significant voxels.
Download pain dataset from neurovault
Here we fetch the pain dataset used in Chang et al., 2015. In this dataset there are 28 subjects with 3 separate beta images reflecting varying intensities of thermal pain (i.e., high, medium, low). The data will be downloaded to ~/nilearn_data, and automatically loaded as a Brain_Data() instance. The metadata will be stored in data.X.
from nltools.datasets import fetch_pain

data = fetch_pain()
metadata = data.X.copy()
subject_id = metadata['SubjectID']
/usr/share/miniconda3/envs/test/lib/python3.8/site-packages/nilearn/maskers/nifti_masker.py:108: UserWarning: imgs are being resampled to the mask_img resolution. This process is memory intensive. You might want to provide a target_affine that is equal to the affine of the imgs or resample the mask beforehand to save memory and computation time.
  warnings.warn(
Run Univariate Regression
We can loop over subjects and predict the intensity of each voxel from a simple model of pain intensity and an intercept. This is just for illustration purposes as there are only 3 observations per subject. We initialize an empty Brain_Data() instance and loop over all subjects running a univariate regression separately for each participant. We aggregate the beta estimates for pain intensity across subjects.
from nltools.data import Brain_Data
import numpy as np
import pandas as pd

all_sub = Brain_Data()
for s in subject_id.unique():
    sdat = data[np.where(metadata['SubjectID']==s)[0]]
    sdat.X = pd.DataFrame(data={'Intercept':np.ones(sdat.shape()[0]),'Pain':sdat.X['PainLevel']})
    stats = sdat.regress()
    all_sub = all_sub.append(stats['beta'][1])
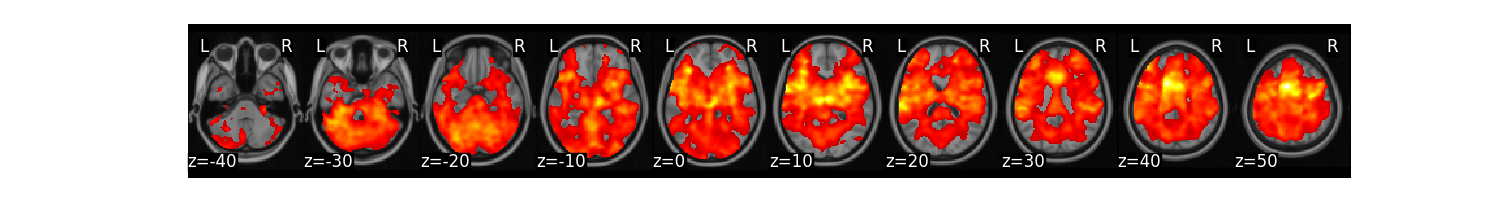
We can now run a one-sample t-test at every voxel to test whether it is significantly different from zero across participants. We will threshold the results using FDR correction, q < 0.001.
t_stats = all_sub.ttest(threshold_dict={'fdr':.001})
t_stats['thr_t'].plot()
/usr/share/miniconda3/envs/test/lib/python3.8/site-packages/nilearn/masking.py:974: UserWarning: Data array used to create a new image contains 64-bit ints. This is likely due to creating the array with numpy and passing `int` as the `dtype`. Many tools such as FSL and SPM cannot deal with int64 in Nifti images, so for compatibility the data has been converted to int32.
  return new_img_like(mask_img, unmasked, affine)
Run Linear Contrast
Obviously, the univariate regression isn’t a great idea when there are only three observations per subject. As we predict a monotonic increase in pain across pain intensities, we can also calculate a linear contrast c=(-1,0,1). This is simple using matrix multiplication on the centered pain intensity values.
all_sub = []
for sub in subject_id.unique():
    sdat = data[metadata['SubjectID']==sub]
    sdat.X = pd.DataFrame(data={'Pain':sdat.X['PainLevel']})
    all_sub.append(sdat * np.array(sdat.X['Pain'] - 2))
all_sub = Brain_Data(all_sub)
We can again run a one-sample t-test at every voxel using an FDR threshold of q < 0.001.
t_stats = all_sub.ttest(threshold_dict={'fdr':.001})
t_stats['thr_t'].plot()

/usr/share/miniconda3/envs/test/lib/python3.8/site-packages/nilearn/masking.py:974: UserWarning: Data array used to create a new image contains 64-bit ints. This is likely due to creating the array with numpy and passing `int` as the `dtype`. Many tools such as FSL and SPM cannot deal with int64 in Nifti images, so for compatibility the data has been converted to int32.
  return new_img_like(mask_img, unmasked, affine)
Total running time of the script: (0 minutes 40.993 seconds)