The DesignMatrix class is the core data structure for working with
csv/tsv/dataframes that capture your experimental design (e.g. a GLM analysis) or
a voxel-wise model (e.g. encoding models, group analysis). It’s backed by polars
internally for fast operations but accepts pandas DataFrames, dicts, and numpy
arrays as input.
Basics
Let’s build a small toy design matrix to learn the basics.
from nltools.data import DesignMatrix
import numpy as np

# A toy blocked design: 4 conditions, 22 TRs, 2s TR (sampling_freq = 0.5 Hz)
dm = DesignMatrix(
    np.array(
        [
            [0, 0, 0, 0],
            [0, 0, 0, 0],
            [1, 0, 0, 0],
            [1, 0, 0, 0],
            [0, 0, 0, 0],
            [0, 1, 0, 0],
            [0, 1, 0, 0],
            [0, 0, 0, 0],
            [0, 0, 1, 0],
            [0, 0, 1, 0],
            [0, 0, 0, 0],
            [0, 0, 0, 1],
            [0, 0, 0, 1],
            [0, 0, 0, 0],
            [0, 0, 0, 0],
            [0, 0, 0, 0],
            [0, 0, 0, 0],
            [0, 0, 0, 0],
            [0, 0, 0, 0],
            [0, 0, 0, 0],
            [0, 0, 0, 0],
            [0, 0, 0, 0],
        ]
    ),
    columns=["face_A", "face_B", "house_A", "house_B"],
    sampling_freq=0.5,
)
DesignMatrix behaves like a polars DataFrame, so familiar methods work — .head(), .tail(), .select(), etc.
dmDesignMatrix(sampling_freq=0.5, shape=(22, 4))# First few rows
dm.head()# Specific columns
dm.select("face_A", "face_B").tail()Visualize it as an SPM-style heatmap — rows are time-points, columns are regressors:
dm.plot()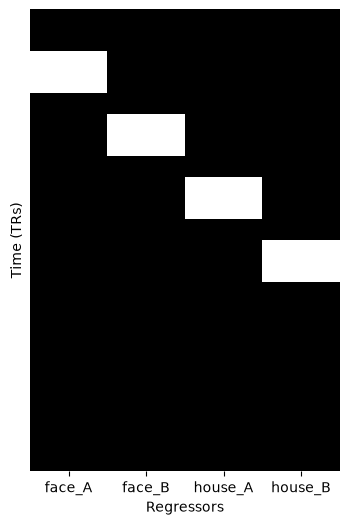
HRF convolution
The hemodynamic response function (HRF) models the sluggish BOLD response to
neural activity. .convolve() applies it to your task columns, renaming the
convolved columns with a _c0 suffix (_c1, _c2, … for multiple kernels) so
they can be referenced deterministically. Notice how the regressors are delayed
and smeared in time:
dm.convolve().plot()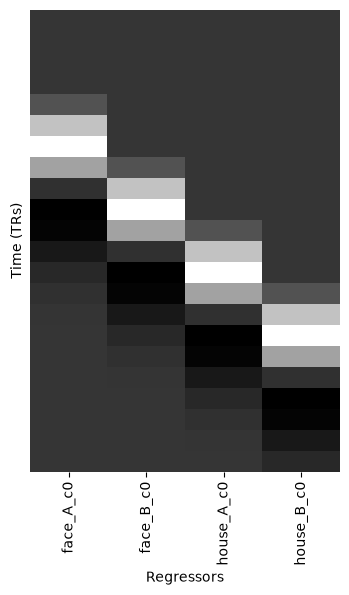
.plot(method='timeseries') draws regressors as line plots. Passing the same ax to a second call overlays the convolved version on the original:
import matplotlib.pyplot as plt

_fig, _ax = plt.subplots(figsize=(8, 4))
dm.plot(method="timeseries", columns=["face_A"], ax=_ax)
dm.convolve().plot(method="timeseries", columns=["face_A_c0"], ax=_ax)
_fig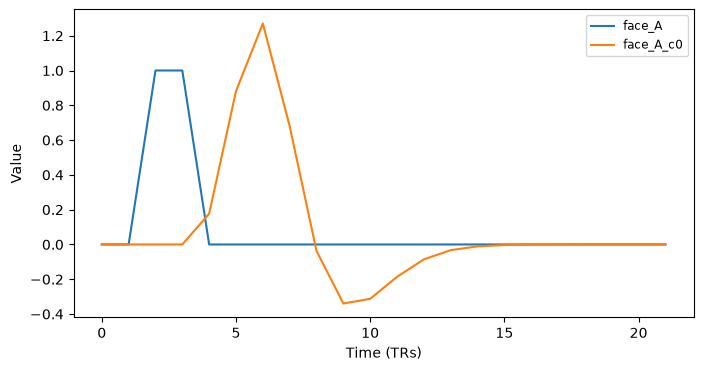
Creating drift regressors
DesignMatrix offers two equivalent ways to add low-frequency “nuisance”
regressors for a GLM: .add_poly() and .add_dct_basis().
Polynomials
Legendre polynomials capture low-frequency trends by order — 0 = intercept, 1 = linear, 2 = quadratic, and so on:
# Up to 4th-order polynomials
dm.add_poly(order=4).plot()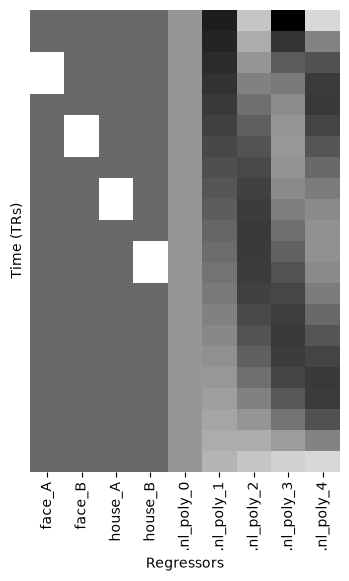
DCT high-pass filter
A common SPM alternative is a set of discrete-cosine filters. duration sets the
high-pass cutoff in seconds:
# A 20s cutoff is roughly equivalent to the polynomials above for this design
dm.add_dct_basis(duration=20).plot()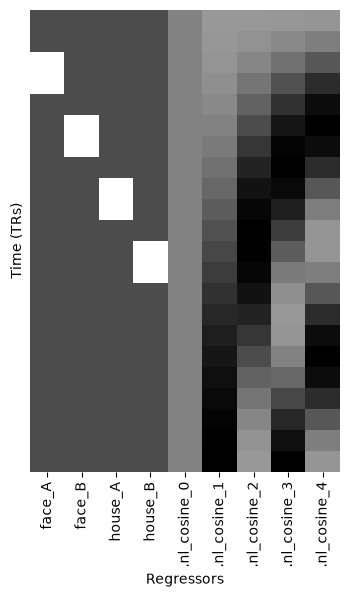
Multicollinearity diagnostics
In classic GLM analysis it’s essential to keep excessive multicollinearity out
of your design matrix, so voxel beta-estimates stay stable. DesignMatrix gives
you two tools: .vif() and .clean().
Variance Inflation Factor (VIF)
VIF measures how much each regressor’s variance is inflated by correlation with the others; values ≥ 5 are classically cause for caution:
dm.vif()array([1.03896104, 1.03896104, 1.03896104, 1.03896104])Visualize a correlation matrix of the columns with .plot(method='corr'):
dm.plot(method="corr")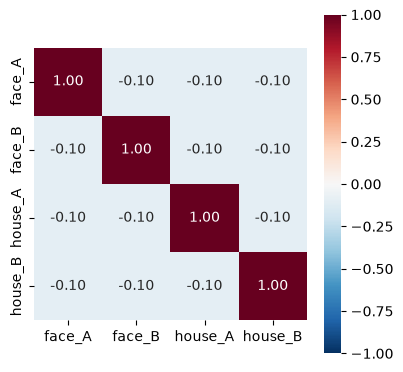
.corr() returns an nltools Adjacency (a labeled similarity matrix), so you can hand it to any of the Adjacency tools:
dm.corr()nltools.data.adjacency.Adjacency(shape=(4, 4), Y=(0, 0), is_symmetric=True, matrix_type=similarity)Cleaning correlated columns
Let’s build a near-degenerate design: a jittered copy of every column, appended
column-wise (axis=1) under new names. (append() refuses exact duplicates
outright — identical values under different names make the design rank
deficient by construction — so we add a little noise to each copy.)
# A jittered copy of the design under new names, appended column-wise (axis=1)
_rng = np.random.default_rng(0)
dm2 = DesignMatrix(
    dm.to_numpy() + _rng.normal(0, 0.02, dm.shape),
    columns=["car_A", "car_B", "dog_A", "dog_B"],
    sampling_freq=dm.sampling_freq,
)
duplicated_dm = dm.append(dm2, axis=1)
duplicated_dm.plot()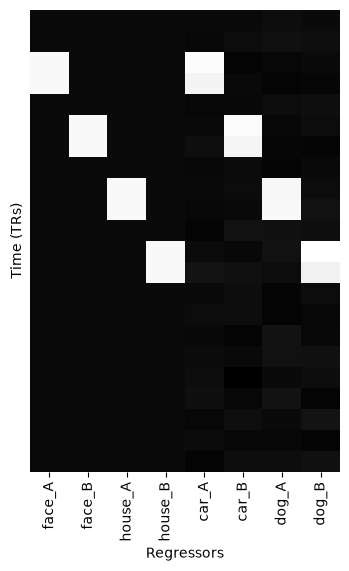
Each copy is almost perfectly correlated with its original (r > 0.95):
duplicated_dm.plot(method="corr")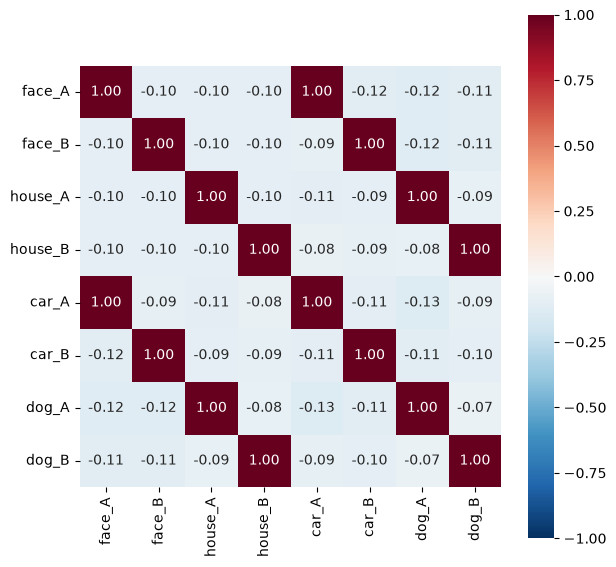
So the variance inflation factors are huge (hundreds, versus ~1 for an orthogonal design):
duplicated_dm.vif()array([893.24475621, 454.15734449, 326.18249463, 387.46426225,
910.3495053 , 454.14666241, 329.84909597, 371.49985693]).clean() drops columns whose absolute correlation with an earlier column meets a threshold (thresh=0.95 by default) — the four jittered copies go, the originals stay:
duplicated_dm.clean(thresh=0.95).plot()Combining runs
.append(axis=0) stacks design matrices vertically — e.g. concatenating runs.
Polynomial columns are kept separate per run by default (keep_separate=True),
while task regressors are stacked so a single estimate is computed across runs:
# Two "runs", each with its own drift terms
run1 = dm.copy().add_poly(order=2)
run2 = dm.copy().add_poly(order=2)
combined = run1.append(run2, axis=0)
combined.plot()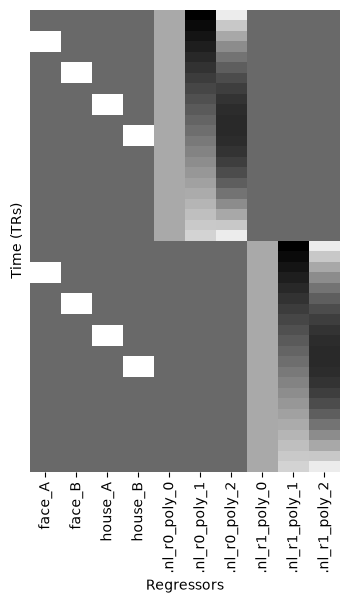
Mixing task regressors with external confounds
Real GLM workflows combine HRF-convolved task regressors with confound regressors
from preprocessing — head motion, spike regressors, CSF/WM signals, physio. The
canonical pattern is .append(axis=1): it accepts a DesignMatrix or a raw
pandas/polars DataFrame, automatically marks the appended columns as confounds
(so .convolve() skips them and they stay separate per run on a later vertical
append), and merges the convolved/confounds metadata correctly.
# 1. Convolve task regressors — convolved columns get a `_c0` suffix; `.convolved` tracks them
dm_task = dm.convolve()
print(dm_task)
DesignMatrix(sampling_freq=0.5, shape=(22, 4))
convolved (4): ['face_A_c0', 'face_B_c0', 'house_A_c0', 'house_B_c0']
import pandas as pd

# 2. Confounds typically arrive as pandas DataFrames from your preprocessing pipeline
_n_tr = dm_task.shape[0]
_rng = np.random.default_rng(0)
motion = pd.DataFrame(
    _rng.normal(size=(_n_tr, 6)),
    columns=[f"motion_{ax}" for ax in ["tx", "ty", "tz", "rx", "ry", "rz"]],
)
csf = pd.DataFrame({"csf": _rng.normal(size=_n_tr)})
spikes = pd.DataFrame(
    {f"spike_{i}": (np.arange(_n_tr) == i * 5).astype(float) for i in range(2)}
)
# 3. Append them all at once, then add drift. Raw DataFrames are auto-wrapped and
# their columns tracked as confounds — no pd.concat round-trip needed.
dm_full = dm_task.append([motion, csf, spikes], axis=1).add_poly(order=2)
print(dm_full)DesignMatrix(sampling_freq=0.5, shape=(22, 16))
convolved (4): ['face_A_c0', 'face_B_c0', 'house_A_c0', 'house_B_c0']
confounds (12): ['motion_tx', 'motion_ty', 'motion_tz', 'motion_rx', 'motion_ry', 'motion_rz', 'csf', 'spike_0', 'spike_1', '.nl_poly_0', '.nl_poly_1', '.nl_poly_2']
dm_full.convolved records the HRF-convolved task regressors; dm_full.confounds records the motion / spike / CSF / drift columns. Both are managed by .convolve() / .append() / .add_poly() and are read-only properties (pass convolved= / confounds= to the constructor to set initial state directly).
dm_full.plot()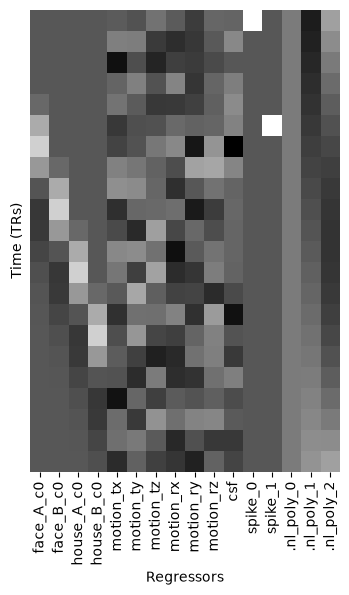
If your confounds are already a DesignMatrix, pass them the same way — as_confounds=True is the explicit knob to mark its columns as confounds even when its own confounds list is empty:
motion_dm = DesignMatrix(motion, sampling_freq=dm.sampling_freq)
dm_full2 = dm_task.append(motion_dm, axis=1, as_confounds=True)
print(dm_full2.confounds)
['motion_tx', 'motion_ty', 'motion_tz', 'motion_rx', 'motion_ry', 'motion_rz']